
As the year comes to a close, brands wrap up the year by looking back at what has taken place to plan for the new year ahead. This is where “Data Storytelling” comes in handy. The Harvard Business School defines this as “the ability to effectively communicate insights from a dataset using narratives and visualisations”. Apart from understanding shopping habits and figuring out which promo mechanic works, many international companies are now using their data to paint a more human picture of their brands to their people. In simpler words, you’re figuring out what data is telling you and sharing that with the people in the form of a story.
Thanks to Today, let’s have a look at some of the best-use examples of data storytelling in content development and ad campaigns, that we at WEBQLO discovered online.
Staying on top of people’s minds: Spotify, Google and TikTok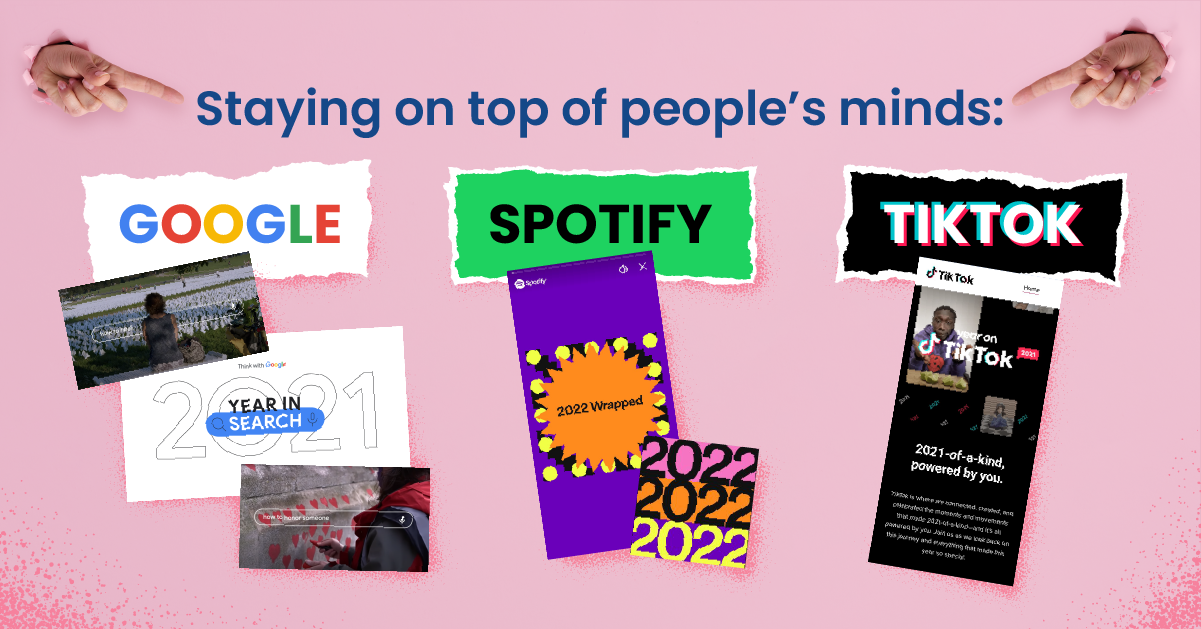
Since the days of reading horoscopes in the newspaper, humans have always been curious to find out more about themselves, and what makes them tick. This is the kind of information that user-generated data can tell a company - information about their audience that the people would certainly love to know.
Google, Spotify and TikTok are three companies that find creative ways to communicate their yearly user behaviour data to their audience. Google’s Year in Search video, which garnered over 239 million views on YouTube for 2021, not only gave people a heartwarming video to watch, but the tech giant also wrote simple articles and infographics to communicate their findings to marketers worldwide. Marketers are then able to strategise their future content and campaigns with information on the top trends and searches of the year before. By doing this every year, Google continues to strengthen its position as a thought leader in the tech industry and makes sure it continues to be the number one search engine in the world.
Spotify, on the other hand, gives each user a personalised Wrapped reel. The reel, which is a personalised report of their listening habits throughout the year, is visualised in a creative and compelling interactive video. The brand personalised top tracks and presents relatable data to the users. Each user will get a customised playlist and recommendations based on their listening habits, allowing them to rediscover old favourites. If they want, they can also view what was trending globally that year. For this reason, people would stick to their subscriptions to know more about their taste in music as well as understand their listening habits on Spotify, which brings us to TikTok.
TikTok rolled out “Year On TikTok” for users to recap their TikTok-ing times of the year. This personalised habit tracker features trends that attracted users the most that year. Based on user activities, users are able to get an outline of their top list of creators, videos, memes and songs. Moreover, they can get to know their tailored most-interacted catalogues, such as sound effects, comment activities, content-sharing tendencies, most-viewed audio, music genre and “vibes”. With the data shared by TikTok, marketers will have more insights into trending online user habits and hot content to help craft their content to their audience's taste.
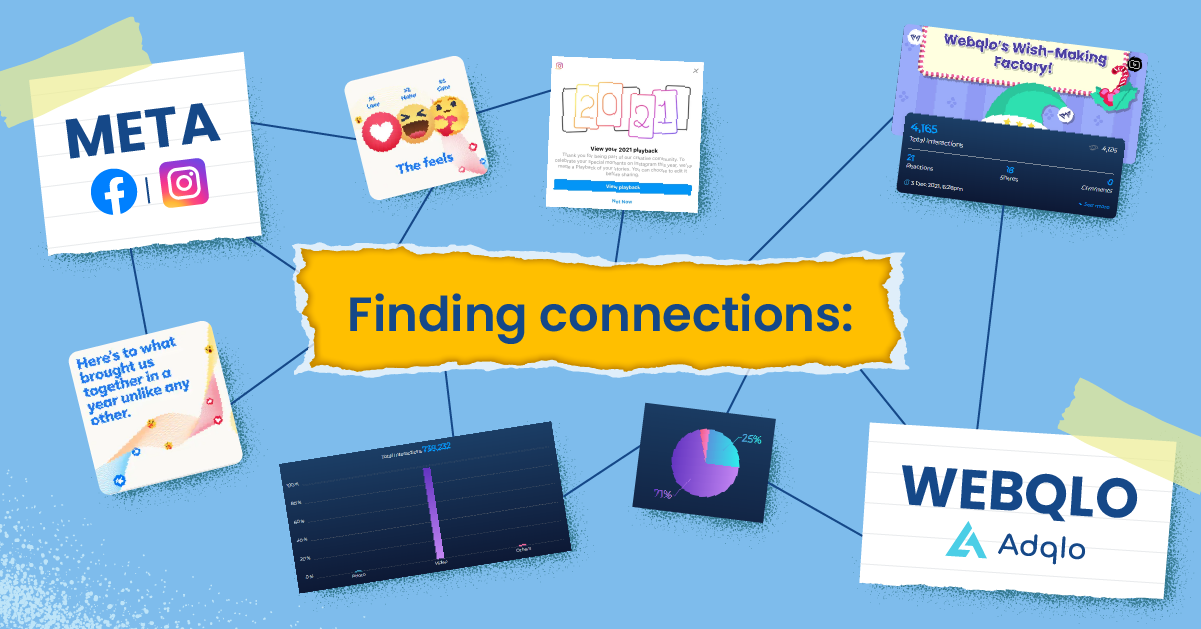
Finding connections: Meta ( Facebook & Instagram ) and WEBQLO
 Staying close to the heart of the users is one of the effective ways of wrapping up the year while engaging users. By tapping into the emotions and the experiences of the users, marketers are able to create relatable contents that draw the attention of users worldwide. Here is what Meta, (formally Facebook) has done to help marketers achieve this goal.
Facebook and Instagram are some of the top platforms for people to keep in touch with their loved ones, especially when many users are trying to remain bonded during the pandemic. In 2021, Meta created Facebook Year Together and Instagram Playback for users to revisit and share their most memorable moments. Facebook’s Year Together is a card that allows users to look back at their top engagements, check-ins and reactions. Instagram’s Playback does the same by giving a year-in-review story feature that suggests the users’ leading stories of the year. As such, Meta is able to remain connected with its users by giving them a space to rewalk special moments of their lives. This form of recap allows both the brand and the users to stay connected. For marketers, it is also an alternative way for them to explore content and strategies that could touch the hearts of the users.
Apart from discovering unusual insights, Data can also show sentiments connected towards social trends, which can be translated into insightful stories that can be presented in various ways, from articles to campaigns. This is important for digital marketers and business owners, as understanding the sentiments connected to certain trends will be really helpful when deciding the creative direction of their campaigns.
Take a look at this article for example https://www.webqlo.com/headlines/article/is-libresses-v-kebaya-packaging-a-dishonour-to-women. Here, we used our social media analytics platform, Adqlo to track two hashtags. With the information we got, we were able to create an article explaining the chronology, sentiment and takeaway from the public feedback on the campaign.
What’s your story?
As we have seen, data isn’t always just a set of numbers to be presented weekly or monthly in meetings, it is a mine for ideas that we need to start digging deeper into. Data storytelling is a fantastic way to create engaging content that would eventually translate to revenue.
If you would like to find out what story your data is telling you, and how you can convey this to your audience, get in touch with us at WEBQLO today.


